Cost Anomaly Detection for Cloud Spend in Production
Catch cloud cost spikes before they compound into thousands in waste.
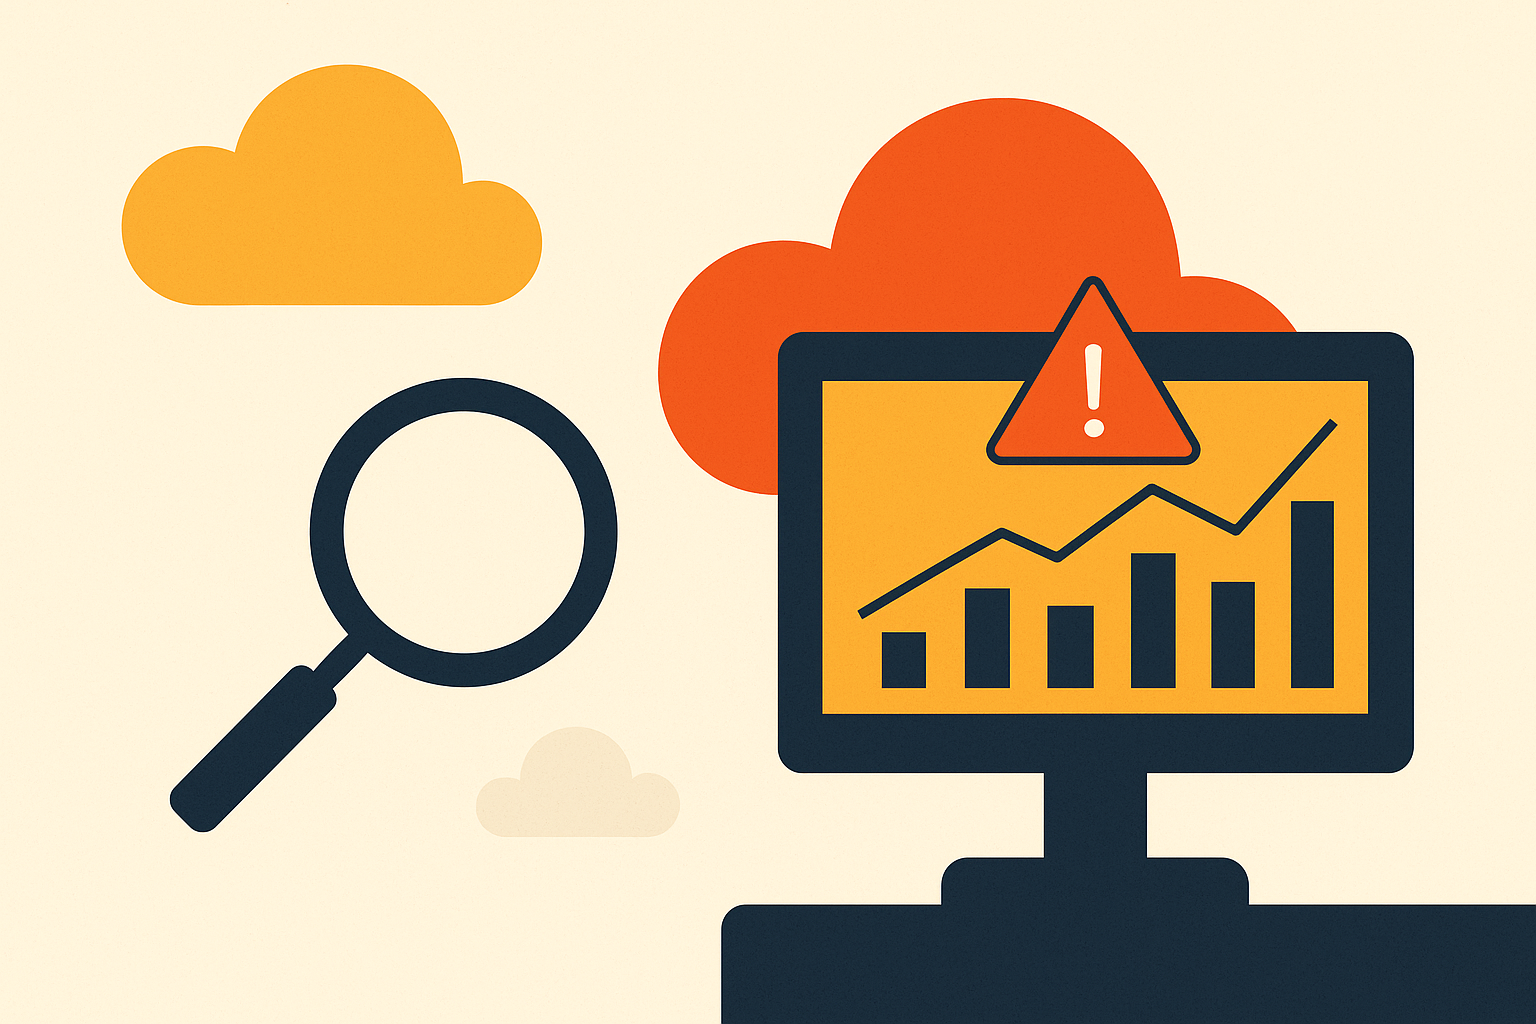
Cost anomaly detection is a production monitoring problem. The FinOps Foundation defines it as unpredicted variation in cloud spend, higher than history says it should be. That word "unpredicted" only means something if you've got a baseline to check against in the first place.
Here's the structural issue that shows up consistently across engineering organizations. Provider billing data can lag up to 36 hours behind the actual cost event, and most teams make that worse by checking spend once a month, or waiting for a budget alert to trip. By the time the invoice shows up, a runaway Lambda function or some S3 bucket nobody remembered to clean up has been burning money for weeks.
Cost data tells you more than what finance wants to know, too. An egress spike can mean data is leaving your environment somewhere it shouldn't. A jump in a non-prod account usually means a load test got misconfigured, or some environment nobody's touched in months is still running and billing away in the background. Non-prod accounts rack up an outsized share of total spend along with the highest rate of anomalies, and this pattern shows up consistently across engineering organizations. The goal is simple, even if getting there isn't: take that 30-day reactive cycle and shrink it to near-real-time, so waste gets caught before it stacks into something painful.
How anomaly detection actually works: baselines, thresholds, and severity
Every anomaly detection system does the same basic thing at its core. It compares what you're actually spending against what history says you should be spending, and flags it when the gap crosses a line.
That line comes in two flavors. Absolute thresholds fire when spend exceeds a fixed dollar amount, say $100 over what was expected. Relative thresholds fire on a percentage, say 20% above baseline. You need both, because neither works alone. A 20% jump on a $5-a-day service is nothing, just noise; a 5% jump on a service that normally runs tens of thousands of dollars a month is real money, and it deserves attention right away.
Granularity counts for just as much as the threshold math does. Baselines need to exist at the level of service, linked account, region, tag, environment, cost center, and Kubernetes namespace, not just at the account level. An account-wide baseline will bury a service-level spike inside a much bigger number, and you'll never see it come up.
Severity classification isn't optional. You need a low, medium, high, critical scale that weighs percentage variance and dollar impact together. A marginal increase on a low-traffic service and a 200% spike on a production database are different events, and they shouldn't get the same response. A low-severity anomaly left alone doesn't stay low; it compounds hour over hour, day over day, so what looked like a minor blip on Monday turns into a few thousand dollars of waste by Friday.
Static thresholds have a blind spot: they can't tell an actual anomaly from ordinary Monday traffic. Machine learning approaches build a predicted mean with a confidence band around it, say a high confidence level, and flag days where actual spend lands well outside that range. That's a real improvement, but it comes with a catch. These models need enough history to build a trustworthy baseline, so a brand-new service or account throws off noisier, less reliable signals for a while, sometimes for months.
None of this matters much if nobody owns the alert. An anomaly with no clear owner gets triaged by nobody, and it just sits there. Tag-based or CMDB-based routing is what turns an alert from a notification sitting in an inbox into an action somebody actually takes.
What native cloud tools (AWS, GCP, OCI) can and cannot do
AWS Cost Anomaly Detection is free, bundled into the Cost Management suite at no extra charge. It builds a baseline per service, account, cost category, or tag group, and you set up subscriptions that define the threshold type, absolute or relative, plus where the alert goes: email, or an SNS topic. Its strength is that it plugs directly into Cost Explorer data, so there's no extra lag beyond the provider's own delay. Its weakness is that alerts fire after the anomaly has already built up some size, not the moment the cost event starts, and everything ties to billing dimensions rather than anything happening at the application layer.
GCP's Cost Anomaly Detection reached general availability in November 2025, on by default for every customer, across every project. The native platform can catch bill shocks before they pile up.
Oracle Cloud rolled out its own Cost Anomaly Detection in January 2026, watching daily cloud costs continuously. You can set up cost monitors with custom alert subscriptions for unusual usage trends.
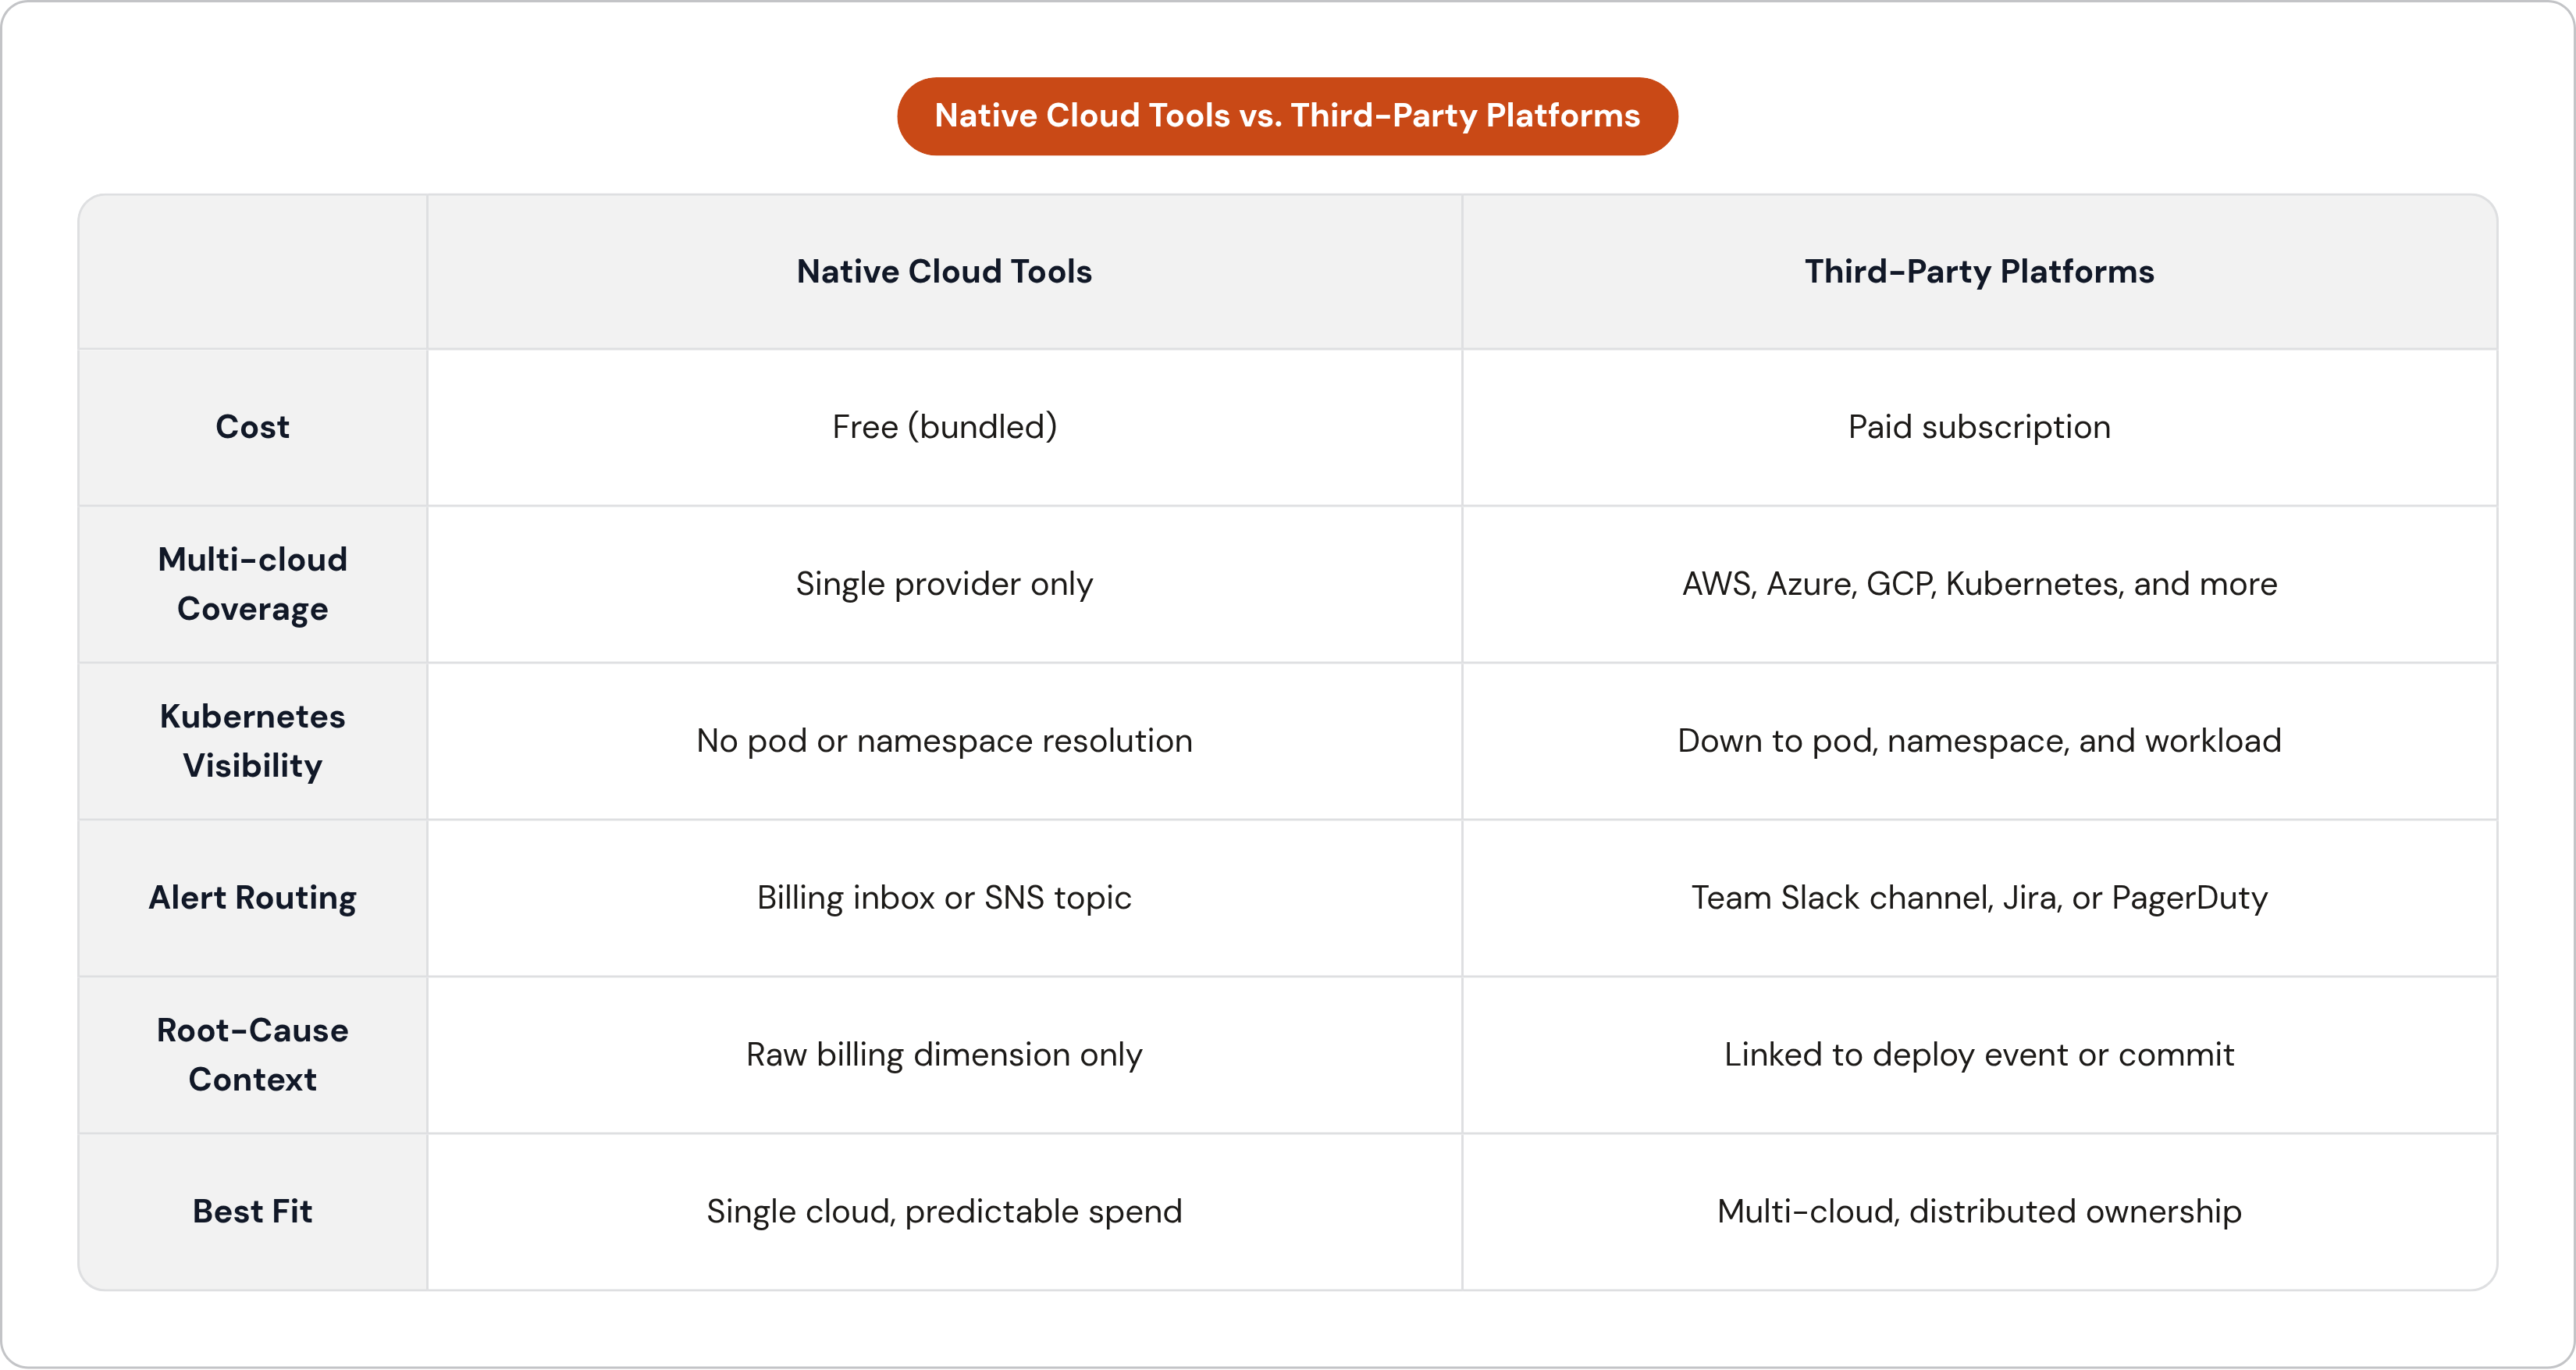
Native tools work fine if you're on a single cloud with fairly predictable spend, and you don't mind zero-config detection that comes with a bit of lag. Where they fall apart is anywhere the environment gets more complicated. Multi-cloud setups leave each provider's tool blind to what's happening on the others. Kubernetes costs never resolve down to the pod, namespace, or workload level. There's no ownership routing, so alerts land in a billing inbox instead of the Slack channel of whoever actually deployed the thing, and there's no way to trace a cost spike back to the deployment or CI/CD event that caused it.
Where third-party platforms add leverage: unit economics, ownership routing, and multi-cloud visibility
The real difference third-party platforms bring is context. They tie a cost anomaly back to what's actually happening in the application, past just which line item on the cloud bill moved.
Feature-level visibility maps anomalies to specific product features, customer segments, or teams, past just "EC2" or "S3." Kubernetes cost allocation goes down to pod and namespace, linked to CI/CD, so a spike traces back to the commit that triggered it. Alerts route automatically to the right Slack channel based on who owns the service according to your tags.
Under the hood, these platforms build dynamic, rolling baselines for each combination of dimensions, and score new data against dollar impact and percentage variance at the same time. Ownership resolution runs through a CMDB, so by the time an alert lands in Jira or ServiceNow, it already carries root-cause context instead of a raw number. Platforms like Anodot apply this kind of detection across AWS, Azure, GCP, Kubernetes, and non-cloud infrastructure all at once, closing the exact gap native tools leave open, since each provider only ever sees its own slice of the picture.
So when do you actually reach for one of these? Multi-cloud or hybrid environments, where native tools only give you a fragmented view, are one case. SaaS companies that need anomaly detection tied to unit economics, cost per customer or cost per feature, are another. So are engineering orgs where cost ownership is spread across a dozen teams, and nobody wants the job of triaging a billing inbox all day.
If you're early-stage, on one cloud, with spend that's still predictable, skip it for now. Extra tooling adds complexity before the problem is big enough to earn it.
Why AI and GPU workloads make cost anomaly detection non-optional
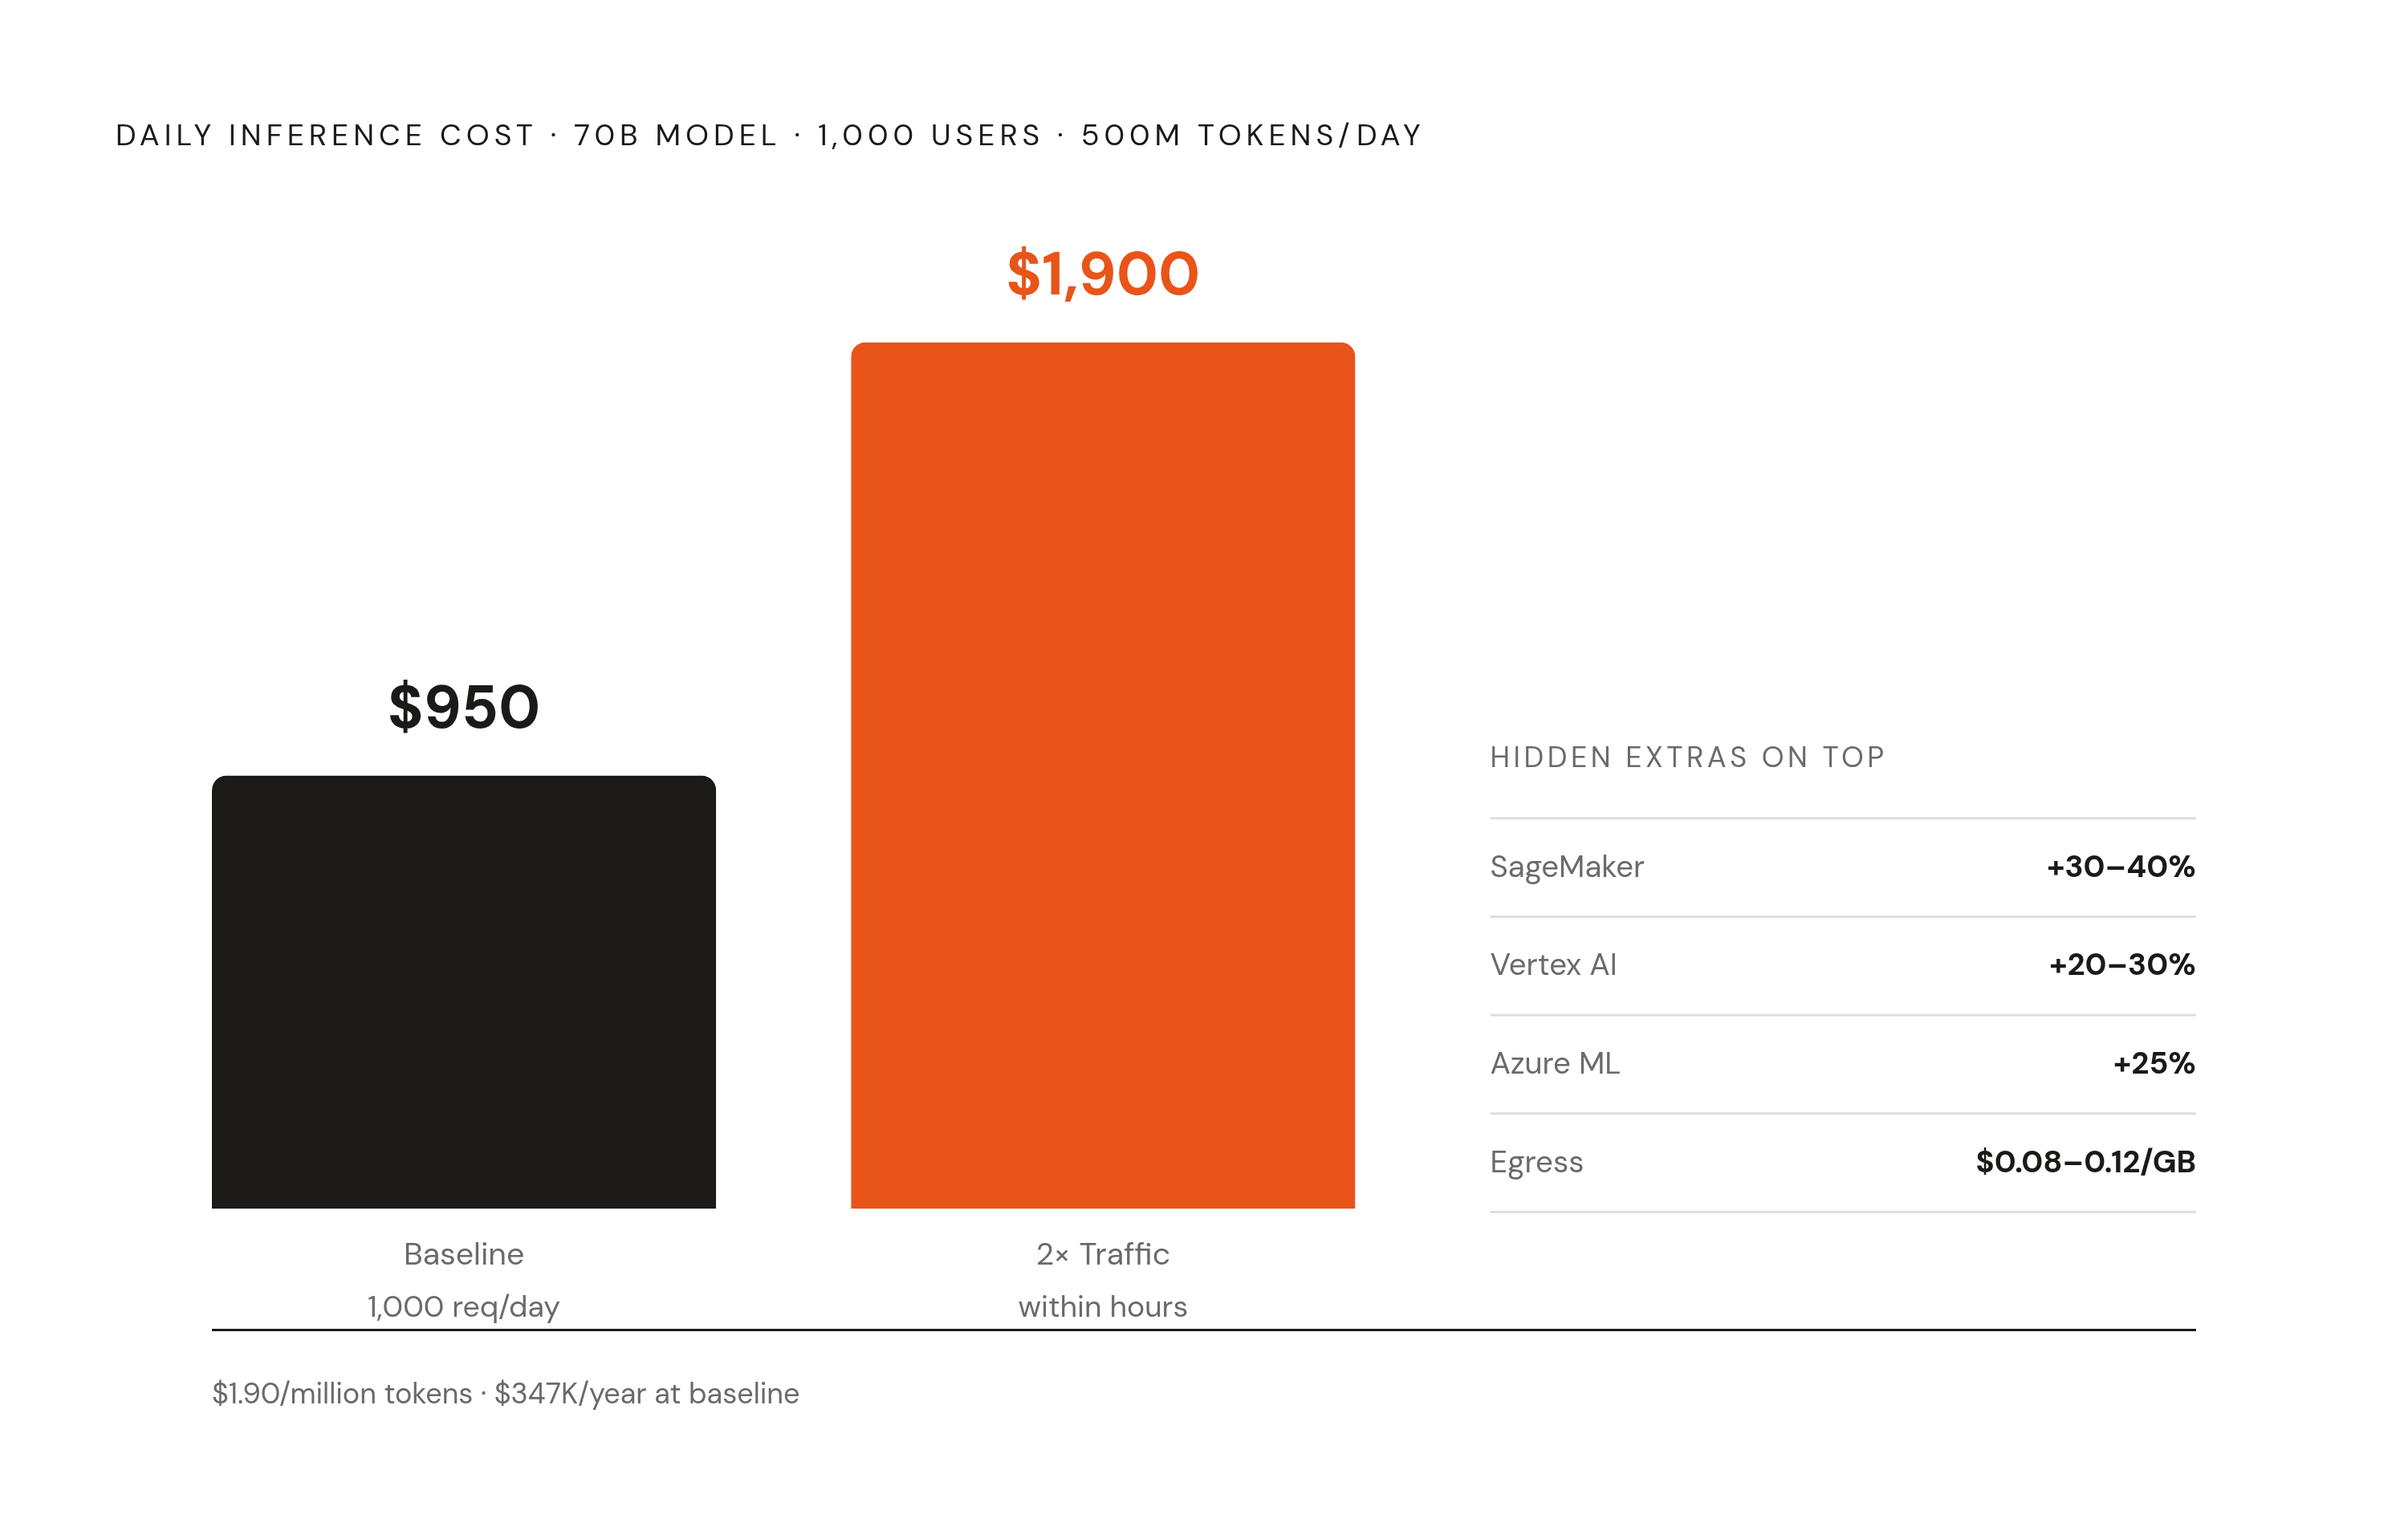
Something's flipped in AI infrastructure spend. Inference now eats roughly 80% of AI infrastructure budgets in 2026, up from a split that used to favor training just two years ago. Once a model ships, serving costs run every hour of every day, forever, with no natural stopping point. Training at least ends when it ends.
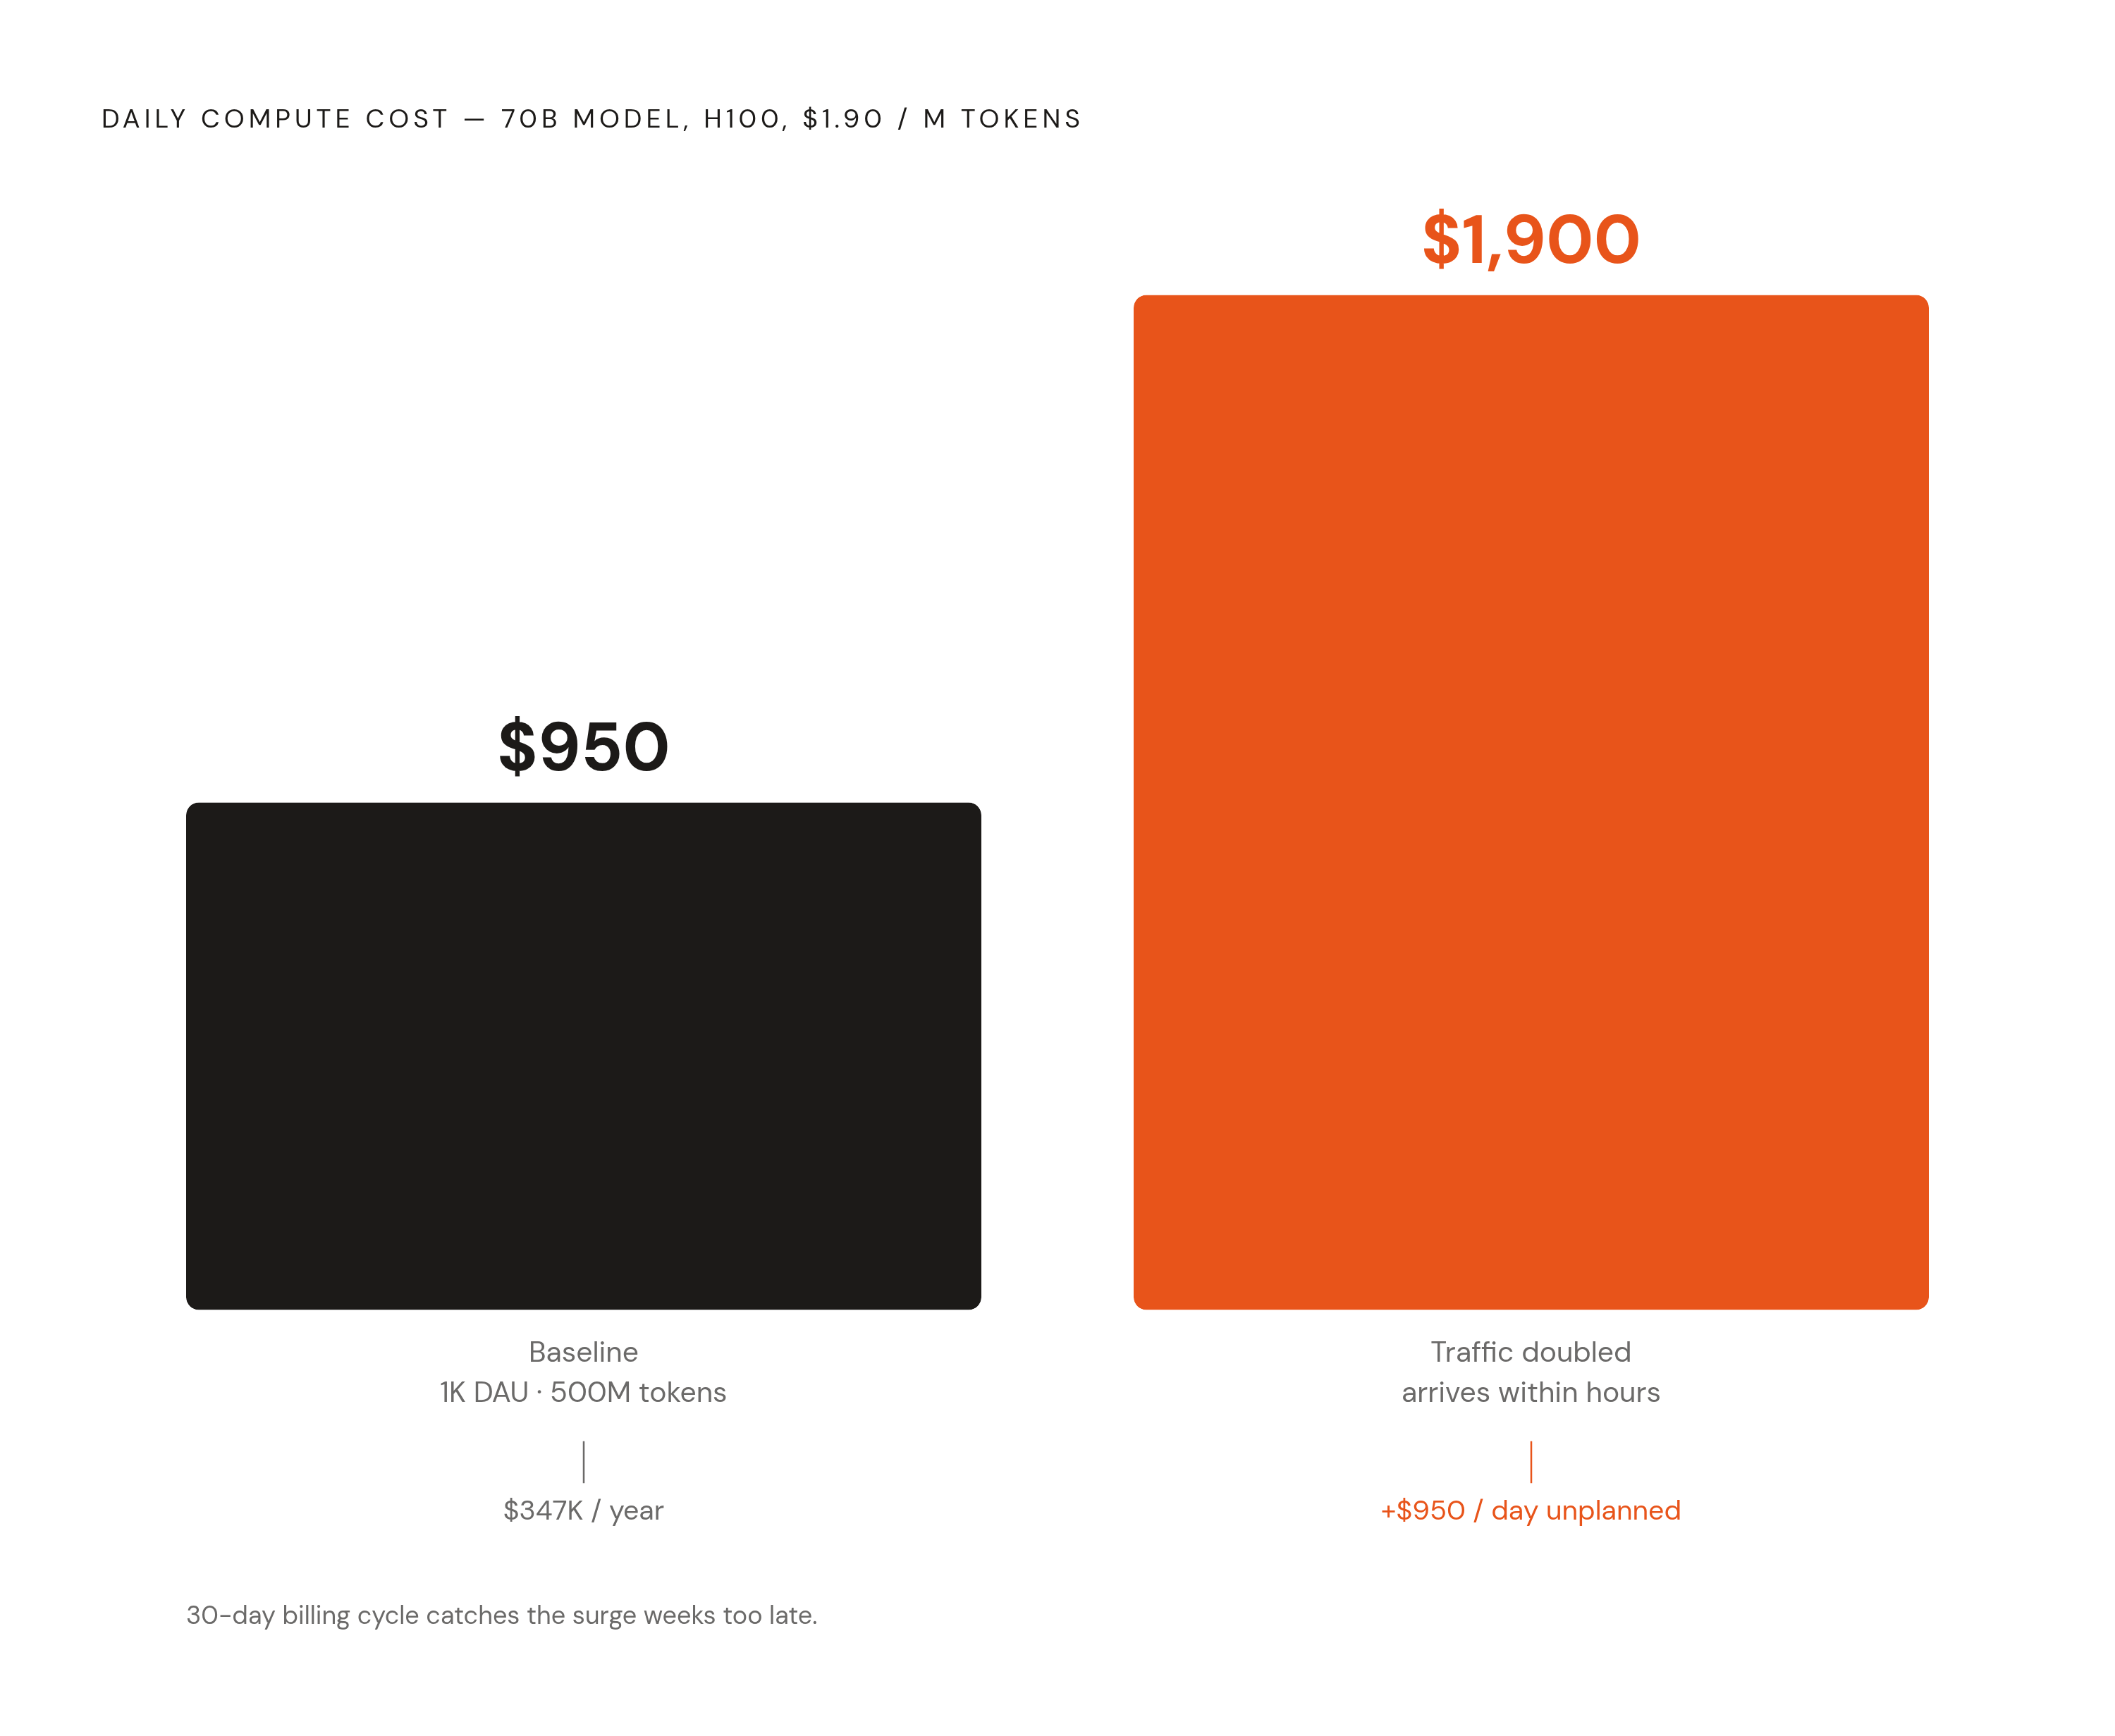
Let me walk through a real deployment. A 70B parameter model serving 1,000 daily active users, each sending 1,000 requests a day at 500 tokens a request, generates 500 million tokens a day. At roughly $1.90 per million tokens on on-demand H100 hardware, that's $950 a day, or about $347,000 a year in compute alone, before you even add egress or infrastructure overhead. Now say traffic doubles unexpectedly: that's $1,900 a day nobody planned for, showing up within hours, not at the end of a billing cycle.
GPU pricing itself won't sit still, which makes the detection problem harder. H100 SXM rental rates run anywhere from about $2.50 an hour on specialized GPU providers to $6.50 or more on the major hyperscalers, and rates can shift significantly even over short periods. One-year H100 lease pricing climbed roughly 40% over five months heading into early 2026, so a baseline built even six months ago might already be stale. Static thresholds break faster on GPU workloads than on ordinary compute; models that adjust as prices shift hold up better.
There are hidden cost categories too, and each one needs its own anomaly coverage. Data egress runs $0.08 to $0.12 per GB on the big clouds, and moving model weights around adds hundreds to thousands of dollars a month. Idle GPU time between inference batches burns money for zero output. Managed ML platforms tack on their own surcharge: SageMaker adds 30 to 40% on top of raw compute, Vertex AI adds 20 to 30%, Azure ML adds around 25%. Altogether these extras can add 20 to 40% to a monthly bill, and each one is its own anomaly surface that needs watching.
This is why the deployment environment matters so much. Teams need infrastructure that surfaces GPU utilization and cost per inference directly, treating a GPU instance as more than just another generic compute box. Platforms that deploy into your own cloud account give you direct access to the provider's billing API, no markup, no data delay sitting in between.
Instrumenting cost anomaly detection as a production practice: what to build and in what order
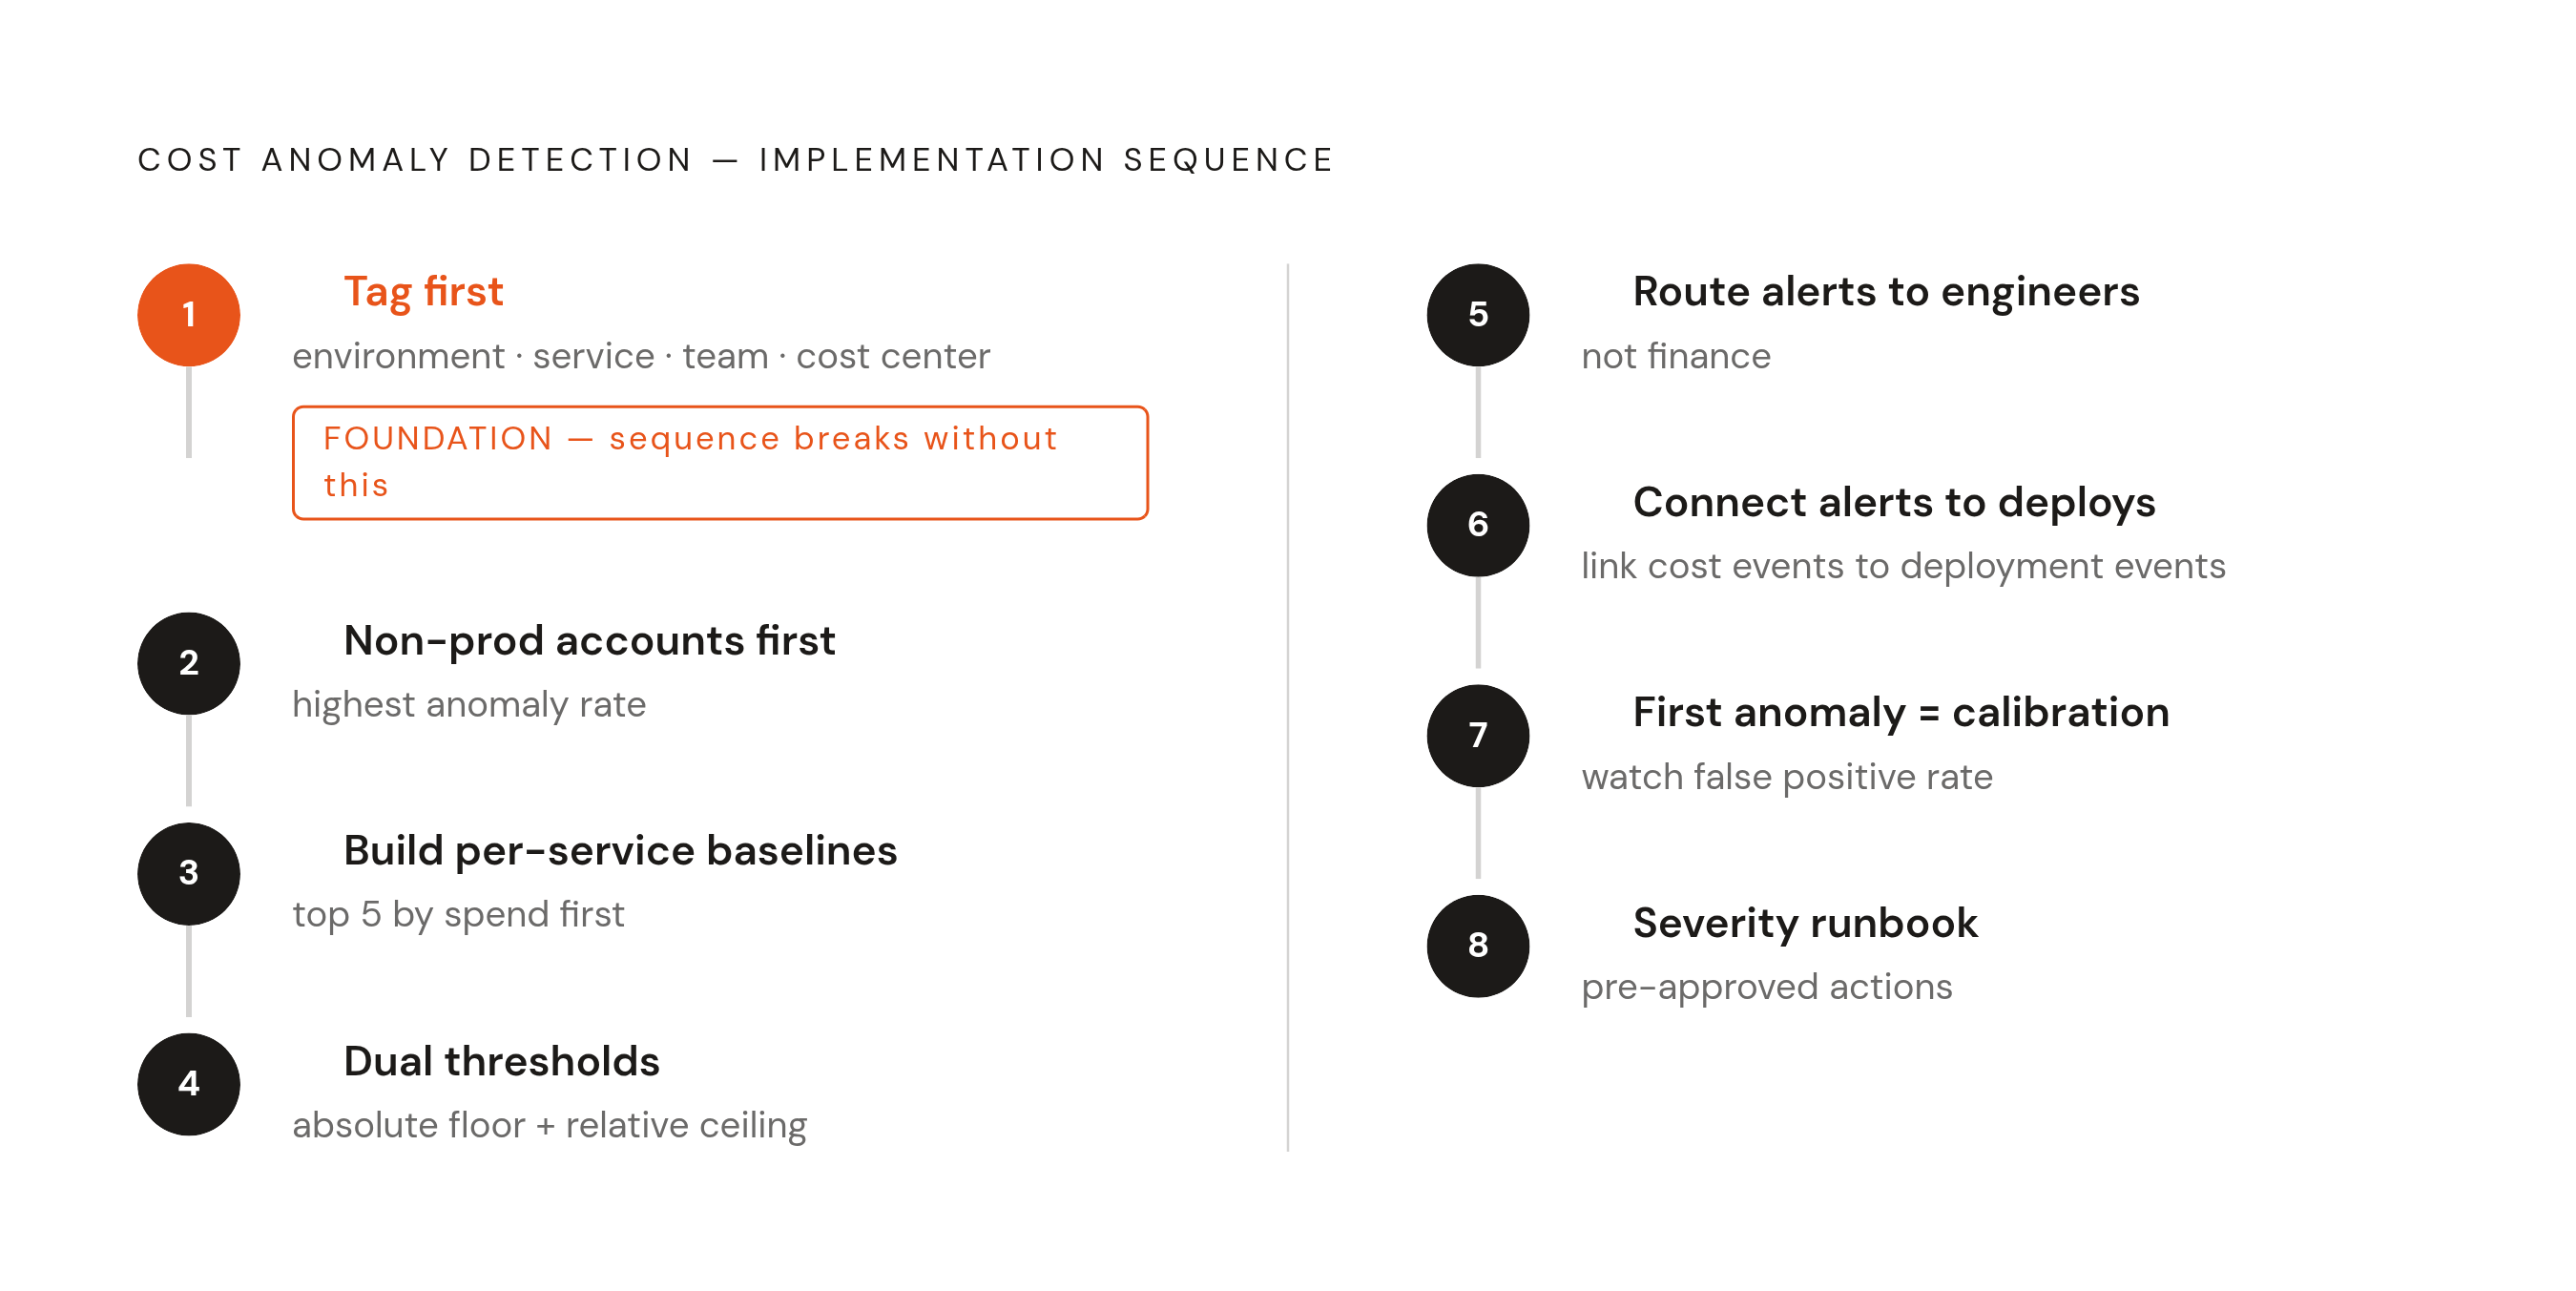
Start with tagging, before anomaly detection. An alert with no owner tag fires into a void that nobody ever picks up. A minimum viable schema needs four fields: environment (prod, staging, dev), service, team, and cost center. Tag non-prod accounts first. They generate a disproportionate share of total spend and the highest rate of anomalies, so they're not the thing to leave for later.
Build baselines per service, not per account. An account-level baseline will hide a $200 spike inside a $50,000 account total without blinking. Start with your five highest-spend services and expand as the process matures.
Set thresholds using both an absolute floor and a relative ceiling. The floor keeps small, cheap services with naturally noisy percentages from setting off alarms nobody needs. The ceiling catches proportional spikes on growing services that haven't hit a big dollar number yet.
Route alerts to engineers, past finance. A cost anomaly in production is an engineering event, and sending it to a billing inbox just adds a handoff that costs hours, sometimes days. Ownership tags should point straight to a Slack channel or a PagerDuty rotation for the team that owns the service.
Then connect cost alerts to deployment events. A spike that lines up with a recent deploy is almost certainly caused by it, so linking cost anomalies back to the commit or deploy that came before them cuts the time to root cause considerably. Most DevOps teams have already brought some form of automation into their CI/CD pipelines; cost anomaly correlation is part of what that shift makes possible.
Treat your first anomaly as a calibration event. Initial thresholds will be off, and you should expect to retune them after the first batch of alerts comes in, watching your false positive rate closely. Too many false alarms and teams learn to ignore the system entirely, which defeats the purpose of building it in the first place.
Last, build a runbook to go with the alert. Every severity level needs a defined first move: who acknowledges it, what they check first, which actions are pre-approved versus which need sign-off. Most DevOps leaders say they're open to agent-based automation, but they want guardrails first: approval steps, rollback options. Cost anomaly response is exactly the kind of use case that calls for it.
The infrastructure layer that makes anomaly detection easier or harder
Shared-tenant PaaS environments create a visibility gap that's easy to miss until it costs you real money. When your workload sits on infrastructure shared with other tenants, cost signals blend together, and the fine-grained detail anomaly detection depends on, service, namespace, deploy event, gets smoothed over before it ever reaches you. The infrastructure layer decides whether an anomaly detection system can actually see the thing it's supposed to watch for, or whether it's staring at a foggy average and hoping for the best.