What Actually Happens When You Deploy to Kubernetes
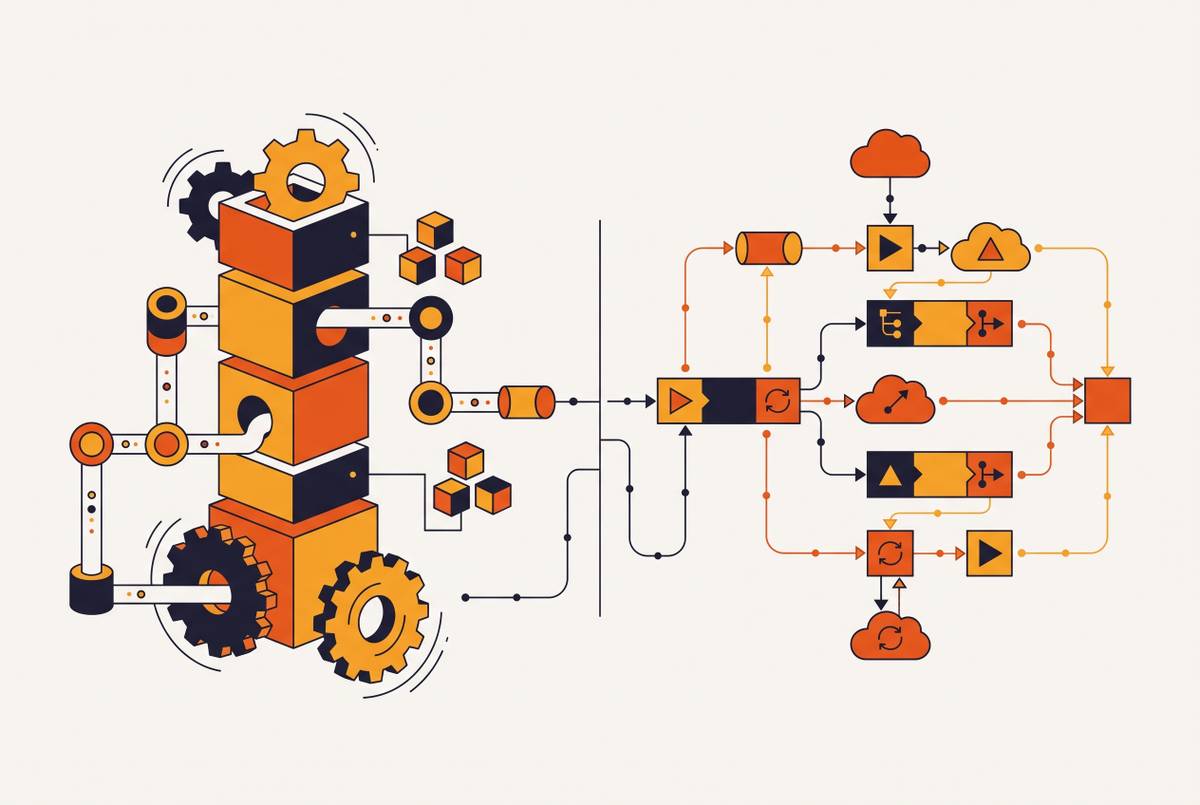
Kubernetes doesn't execute commands—it continuously reconciles your desired state with reality.
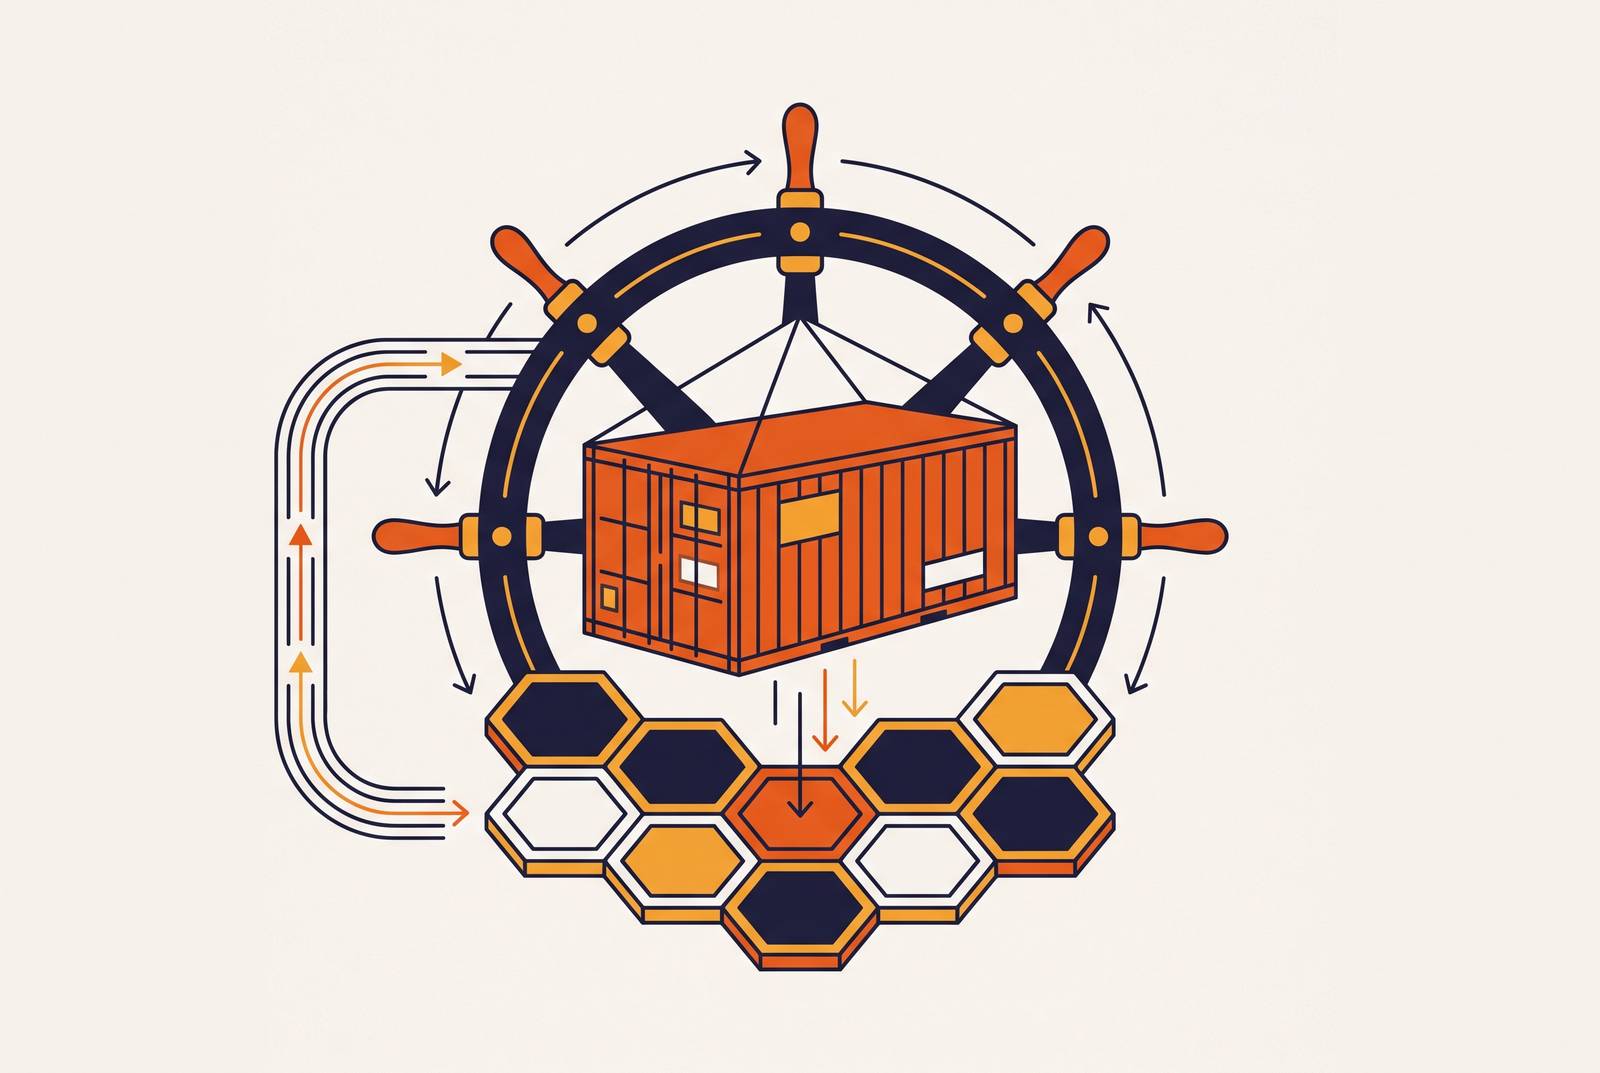
Kubernetes runs on a single mechanical idea: you declare what you want, and a set of controllers spend forever closing the gap between that and what actually exists. It's a reconciliation loop, running continuously, not a task runner that executes your command and reports back. It's a reconciliation loop, running continuously, and understanding that loop is what separates an engineer who fixes a 3 a.m. incident in ten minutes from one who's still staring at logs an hour later. This matters more now than it used to. The CNCF's 2025 Annual Survey put container users running Kubernetes in production at 82%, up sharply from 66% in 2023. That's not a niche skill anymore.
Every error message you'll ever read traces back to four components: the API server, etcd, the scheduler, and the kubelet. The API server is the front door, the only thing that talks to etcd directly. etcd is the database, the single source of truth for cluster state. The scheduler decides which node a pod lands on. The kubelet runs on that node and actually starts the container. Everything else in Kubernetes is built from these four pieces cooperating, or occasionally not cooperating, with each other.
There's a hierarchy underneath almost every workload: Deployment creates ReplicaSet, ReplicaSet creates Pod. You almost never create a Pod directly in production, because if it dies, nothing brings it back. Five object types cover the vast majority of real applications: Deployment, Service, Ingress, ConfigMap, Secret. Think of these less as a feature list and more as vocabulary, the words you use to write a precise description of what you want running.
kubectl apply doesn't do anything. It records an intention. If the apply succeeds and nothing seems to happen, that's not a bug, that's the system working as designed. It means the cluster accepted your intent, and something downstream isn't able to satisfy it yet. Finding out what requires reading events, not logs, and that one habit alone will cut your debugging time more than almost anything else on this list.
What happens inside the cluster from the moment you run kubectl apply
The API server receives the manifest first. Before that object ever touches etcd, four things happen in sequence: authentication (who are you), RBAC authorization (are you allowed to do this), schema validation (is this configuration file even a valid object), and admission control (does this pass the cluster's policy rules).
As of Kubernetes v1.36, a lot of that policy enforcement runs through CEL-based mechanisms, ValidatingAdmissionPolicy and MutatingAdmissionPolicy, the latter having reached general availability in v1.36. Both run in-process inside kube-apiserver. That matters practically: no external webhook to manage, no TLS certificates to rotate, lower latency on every single object you create. A few years ago, this kind of policy check often meant standing up a separate webhook service. Now it's built in.
Once the object clears admission control, it gets written to etcd. etcd uses Raft consensus to keep its data consistent across replicas, and it is genuinely the single point of catastrophic failure in a cluster. Lose etcd without a backup, and you lose the entire cluster's state: every Deployment spec, every Secret, every ConfigMap, gone. Back it up like it's the only thing that matters, because it is.
From there, the sequence unfolds:
- The Deployment controller notices the new desired state and creates a new ReplicaSet for the updated pod template, while keeping the old ReplicaSet around for rollback.
revisionHistoryLimitcontrols how many of these old ReplicaSets stick around. - The scheduler picks up any unscheduled pods and assigns them to nodes, using resource requests, not actual usage, to make that decision. Skip setting requests, and Kubernetes assumes they're close to zero. It'll happily pack far more pods onto a node than it can actually support. The slowness that follows looks like an application problem. It doesn't look like a scheduling problem, but it is one.
- The kubelet on the assigned node pulls the container image and starts it.
- Probes begin. The readiness probe decides if the pod gets traffic. The liveness probe decides if the container gets restarted.
- As new pods pass their readiness checks, the old ReplicaSet scales down. This is the rolling update, happening in real time.
Start to finish, a typical deploy stabilizes in somewhere around 30 to 60 seconds, depending on how long the pod takes to start and how the probes are timed. If you're on a managed control plane like EKS, GKE, or AKS, the cloud provider runs the API server, etcd, and scheduler for you, and bills an hourly fee for the privilege. You still need to understand this chain. You just don't have to operate the first three pieces of it yourself.
How the rolling update strategy controls the pace and safety of the swap
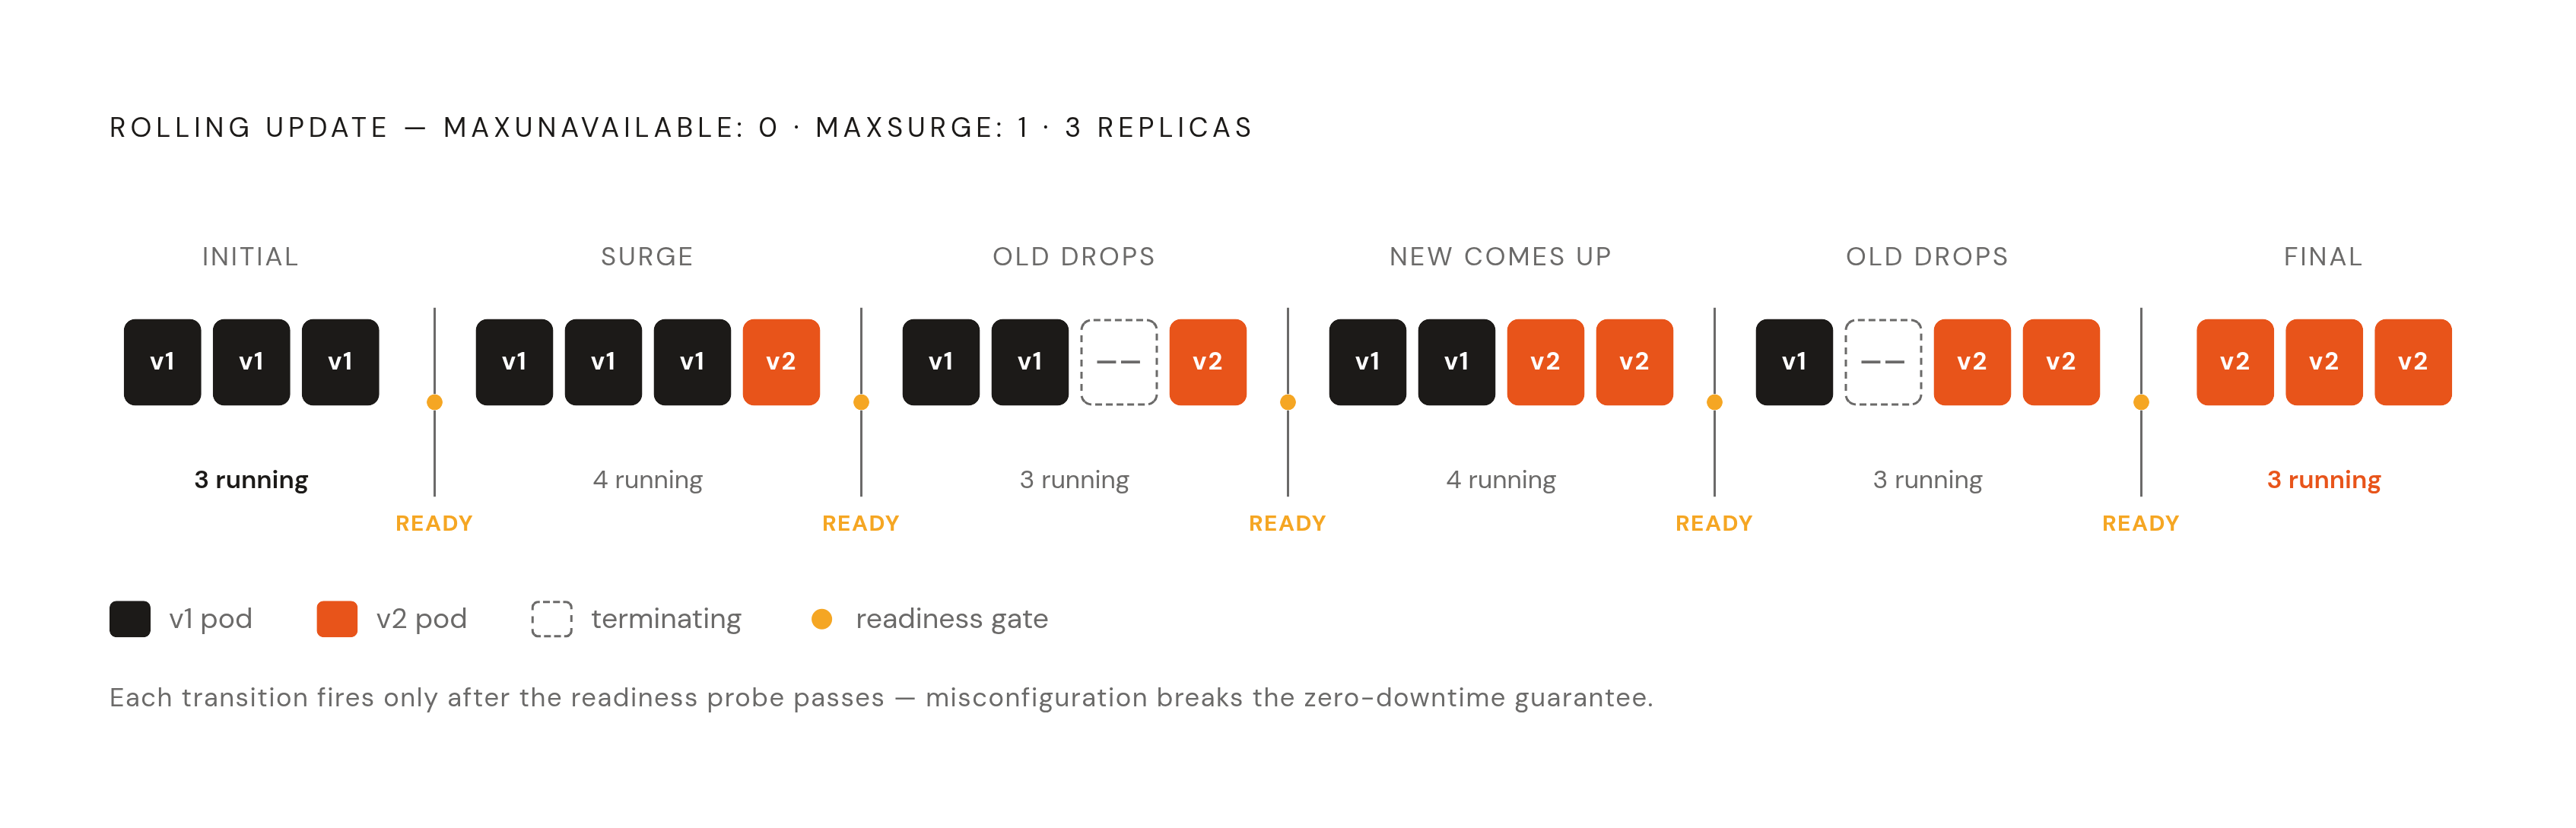
Rolling update is the default strategy in Kubernetes, and the whole point is that traffic never stops flowing while old pods get swapped for new ones. Two parameters govern how that swap happens: maxUnavailable and maxSurge. The default surge is 25% of your desired replica count. Setting maxUnavailable: 0 and maxSurge: 1 makes Kubernetes add one new pod, wait for it to pass readiness, remove one old pod, and repeat, never letting your capacity dip below what you asked for.
What that looks like with three replicas, moving from v1 to v2:
Initial state: [v1] [v1] [v1]. Then it surges: [v1] [v1] [v1] [v2], four pods total. One old pod terminates: [v1] [v1] [--] [v2]. Another new pod comes up: [v1] [v1] [v2] [v2]. Another old one drops: [v1] [--] [v2] [v2]. Final state: [v2] [v2] [v2], deployment stable.
Every one of those transitions is gated by the readiness probe. If that probe is misconfigured, none of the "zero downtime" promise actually holds, no matter what the rollout status says.
Two more settings act as safety nets. progressDeadlineSeconds (a common value is 600) tells Kubernetes: if this rollout hasn't made progress in ten minutes, mark it failed instead of hanging silently forever. minReadySeconds makes a pod prove it can stay ready for a stretch before counting as available, catching the pod that passes its check and then immediately falls over.
Contrast all of this with the Recreate strategy, where every old pod stops before a single new one starts. Downtime is guaranteed, on purpose. That's the right call when two versions genuinely cannot coexist, like a database schema migration or a singleton process that can't run twice.
Blue/green and canary deployments are extensions of this same underlying idea, not separate systems. Canary requires something outside core Kubernetes, a load balancer, an ingress controller, or a service mesh, to split traffic precisely between versions. Blue/green can be done with just two Deployments and a Service selector patch. Neither one is a first-class Kubernetes object. Both are patterns built on top of what's already there.
Why probes are the single most consequential configuration decision in a deployment
Skip the definition and go straight to the failure. A rolling update with no readiness probe sends traffic to a pod the moment the process exists, even while it's still opening database connections or warming a cache. Meanwhile the old pod is already gone. Requests start failing, and the deploy still reports success, because as far as Kubernetes is concerned, nothing went wrong.
Readiness and liveness ask two completely different questions, and confusing them is how you get a cascading outage:
- Readiness asks: should this pod get traffic right now? Fail it, and the pod comes out of the load balancer rotation. Nothing restarts.
- Liveness asks: is this container stuck in a way it can't recover from on its own? Fail it, and Kubernetes kills and restarts the container.
The classic self-inflicted disaster: pointing a liveness probe at an endpoint that gets slow under heavy load. Traffic spikes, the endpoint slows down, the liveness check fails, and Kubernetes kills a perfectly healthy pod right when it's needed most. That shifts load onto the remaining pods, which then also slow down, which then also get killed. It's a death spiral the platform builds for itself.
The rule that prevents it: liveness should only test something that can't fix itself, like a deadlock, and it should never touch a database or any downstream service. If the database is slow, that's a readiness problem, not a reason to kill the container.
Probes come in three flavors: HTTP, TCP, or a command run inside the container. A well-configured production manifest tends to use HTTP GET checks for both, with timing that looks something like this: initialDelaySeconds of 30 for liveness and 10 for readiness, periodSeconds of 10 for liveness and 5 for readiness, and a failureThreshold of 3, requiring three consecutive failures before Kubernetes acts. None of this is optional in a production system. Missing health probes sit alongside missing resource limits and weak observability as one of the most common root causes behind real production failures.
What resource requests and limits do to scheduling and runtime behavior
Requests are how the scheduler decides where a pod fits. They're the number the scheduler treats as a floor, not a suggestion or a performance hint. They're the number the scheduler treats as gospel when deciding whether a node has room.
Limits are a different animal entirely: they're enforcement. A CPU limit throttles the container once it hits the ceiling. A memory limit kills it outright. Exit code 137 is that kill signal, OOMKilled, exceeded the memory limit, terminated.
A typical production manifest might set requests at 128Mi memory and 100m CPU, with limits at 256Mi memory and 500m CPU. Get the CPU limit wrong, and you get latency nobody can explain, because throttling doesn't appear in standard container metrics by default. Someone spends an afternoon profiling application code that was never the problem.
If you skip setting requests entirely, the scheduler assumes the pod needs almost nothing, packing far more onto each node than it can actually handle. The resulting slowness reads like an application bug. It's actually a scheduling decision made with no real information. Pods that run with no limits set at all are the default in a lot of clusters, not the exception, and misconfiguration in container environments is a widely documented problem across the industry.
CrashLoopBackOff is what you see when a container keeps failing to start. Kubernetes restarts it with exponentially increasing delay, capped at 5 minutes. That cap matters practically: it tells you how long to wait before deciding whether a restarting pod is going to stabilize on its own or whether something deeper is actually broken.
Why termination order matters for in-flight requests during graceful shutdown
When a pod gets removed during a rolling update, Kubernetes sends SIGTERM and starts a countdown, 30 seconds by default, before it gives up and sends SIGKILL. Simple enough in theory. In practice, there's a race condition baked into the design: the Service stops routing to that pod and SIGTERM gets sent at roughly the same time, not one after the other. That means in-flight requests can still land on a pod that's already begun shutting down.
The fix is a preStop hook, a short pause before the process actually exits, giving the network enough time to catch up and stop sending it new requests. A common pattern: preStop: exec: command: ["/bin/sh", "-c", "sleep 5"], paired with terminationGracePeriodSeconds: 30. Five seconds of patience, and a whole category of dropped requests disappears.
Init containers and sidecars add their own wrinkles to shutdown order. Init containers run to completion before the main container ever starts, that part's straightforward. Sidecars, though, often outlive the main container unless you've explicitly configured otherwise, which is exactly the kind of quiet detail that causes confusing shutdown failures in service mesh setups.
Topology spread constraints matter alongside this. Spread three replicas across different nodes, and a single node failure during a rolling update won't simultaneously take out a surge pod and an existing pod. That's a scheduling decision, but it's really part of the same conversation, keeping the system resilient while it's mid-transition.
The three failure modes that most production incidents trace back to
Missing resource limits, skipped health probes, and weak observability. Missing resource limits, skipped health probes, and weak observability repeatedly cause production failures. Each piece has already been covered on its own. What matters here is how they show up together, in practice, at 3 a.m.
Pods stuck in Pending mean the scheduler can't place them anywhere. The first move isn't checking logs, it's running kubectl describe pod and reading the events. Almost always, the cause is resource requests that exceed what any node has available, or a node selector pointing at a node that doesn't exist.
CrashLoopBackOff means the container starts and dies, repeatedly. Exit code 137 means OOMKilled, memory limit set too low. Other exit codes usually point to an application error, something in the code itself rather than the infrastructure around it. Remember that 5-minute cap on the backoff delay, because it means the symptoms of a crash loop can take a while to fully show themselves.
The third failure mode is the sneaky one: the deploy reports success, and traffic drops anyway. Either the readiness probe passed too early, or there's no preStop hook and in-flight requests are hitting a pod that's already shutting down. From the outside, the deploy pipeline looks completely clean. Users are the ones who find out something's wrong.
Standard Kubernetes doesn't proactively alert on any of this. Memory spikes, pod evictions, and container crashes are invisible unless a monitoring stack is deployed and watching for it. That gap turns a routine blip into an actual incident.
The diagnostic order that covers most situations: events first, then logs, then probe configuration, then resource metrics. That sequence isn't arbitrary, it matches the order in which the control loop actually surfaces information.
And when things go wrong, kubectl rollout undo only restores the pod template. It says nothing about application data, and it will not reverse a database migration. That's usually the moment engineers learn the limit of rollback the hard way, mid-incident, with a schema change already applied and no clean way back.
What the deployment chain looks like when the workload is a GPU inference service
Most generative AI workloads run on Kubernetes, and inference, not training, is where most AI compute actually goes today. That shift changes what the deployment chain needs to handle, because the standard scheduler simply wasn't built with GPUs in mind.
Two problems appear that the default Deployment logic can't solve on its own. Gang scheduling, first: distributed training jobs need every pod to start at the exact same time, or the whole job fails outright. The incremental, one-at-a-time logic behind a normal rolling update breaks that requirement completely. Second, GPU resource allocation: the default scheduler has no built-in notion of fractional GPU sharing, and no awareness of multi-node NVLink topology.
The stack that's become standard for handling this is the NVIDIA GPU Operator running on the nodes themselves, vLLM as the inference engine, and KServe or KubeAI as the serving layer on top. KServe joined the CNCF as an incubating project in September 2025, which is a signal of production maturity, not an experimental bet.
NVIDIA donated its Dynamic Resource Allocation driver to the CNCF at KubeCon Europe 2026. That driver handles fractional GPU allocation and multi-node NVLink setups, and it's now governed by the broader community, with AWS, Google Cloud, Microsoft, Broadcom, Canonical, Nutanix, Red Hat, and SUSE all collaborating on it upstream. That's a meaningful shift, moving a core piece of GPU scheduling out of one vendor's hands and into shared infrastructure.
NVIDIA's MIG technology on A100 and H100 GPUs takes this further still, partitioning a single physical card into up to 7 isolated instances. Using the 1g.10gb profile on an A100 80GB node, that's 7 separate small-model inference endpoints running on one piece of hardware, each with its own memory isolation enforced at the hardware level.
Readiness probes carry over from everything covered earlier, but the stakes look different here. Model load time for a large inference service can run far longer than a typical web app's startup, and the same probe mistakes discussed above apply just as sharply, only now initialDelaySeconds needs to be set much higher. Get that wrong on a GPU node, and Kubernetes will kill a pod that was never actually broken, just still loading a model into memory.
Sources
- Kubernetes Deployments 2026: Rolling Updates | Vucense
- Kubernetes Explained for People Who Ship Software
- Inside Kubernetes The 2026 Architecture Breakdown
- Deployments
- 🤔 What Really Happens When You Run kubectl apply? Episode 3
- Kubernetes Architecture: What Actually Happens Between `kubectl apply` and a Running Pod
- kubernetes.io
- devopscube.com